The world of mapping and presenting data sets through geographical representations is no longer relegated to GIS librarians and highly trained technologists. New free and open source applications now make it possible to create complex and robust data visualizations in the form of maps that display statistics and poll results. Here's a guide to 20 free applications and data sources.
Data Visualization Tools
-
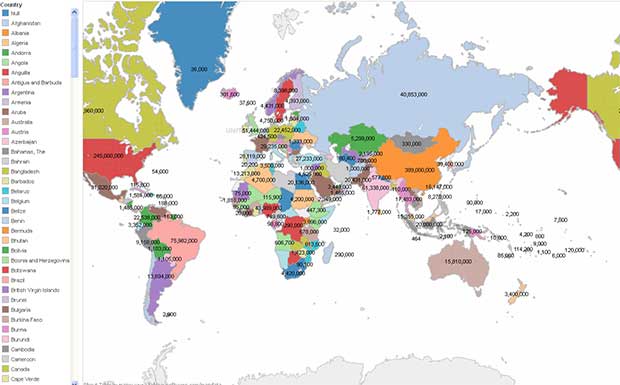
Tableau Public
This free, highly sophisticated software enables the lay person to create very complex graphical representations of data sets in minutes. The above image is actually an interactive map that I created in just a few minutes (after watching the tutorial video) with a data set I downloaded from the CIA World Fact Book comparing internet users in countries worldwide. Data can be uploaded in many forms including Excel spreadsheets, text documents, and Microsoft Access and can be displayed on a map, as well as bar, area, line, or pie charts, as tables, treemaps and more. See the gallery of visualizations here.
-
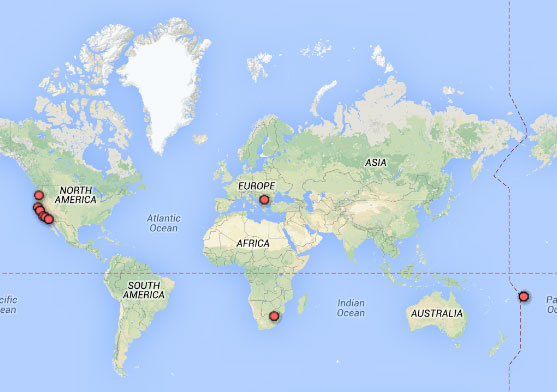
Google Fusion Tables
Google's experimental Fusion Tables functionality allows you to upload an Excel spreadsheet and instantly create charts and maps from the data set. It was incredibly easy to create the above map after searching the NOAA database for statistics on tsunami locations within the past 10 years.
-
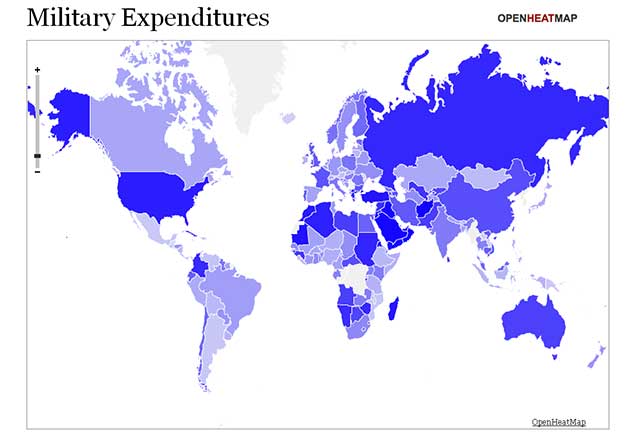
Open Heat Maps
This simple and straightforward map generator lets you quickly upload your Excel or Google Docs spreadsheet and adjust the colors and settings for your custom map. It took less than 5 minutes to create the above map with data on country military expenditures generated from the CIA World Fact Book. See the gallery of other heat maps here.
-
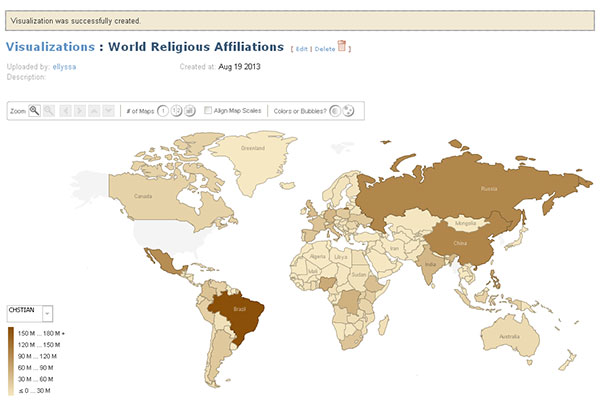
Many Eyes
This free Web-based application is a bit more sophisticated than some of the other tools available, and therefore has a steeper learning curve. Many eyes enables users to create detailed, interactive maps by uploading a spreadsheet and then specifying your preferred visualization type. This map of worldwide religious affiliations was created in just 20 minutes with a data set from ARDA. Additionally, simple maps can be created on the ARDA website in the GIS Maps section.
-
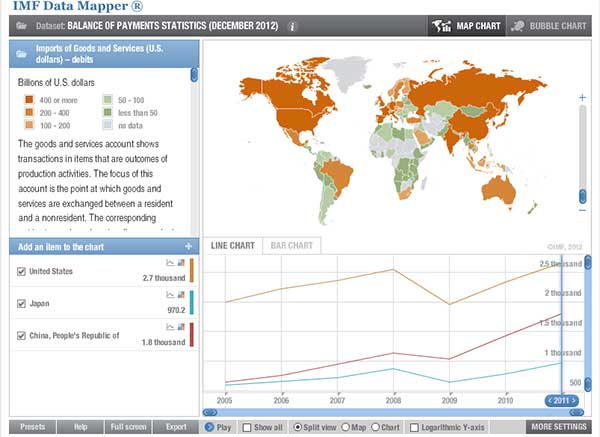
International Monetary Fund (IMF) Data Mapper
Instantly create robust maps using the IMF Data Mapper tool on their website. Users cannot upload their own data sets, but instead can use any of the reports and data within the IMF site.
-
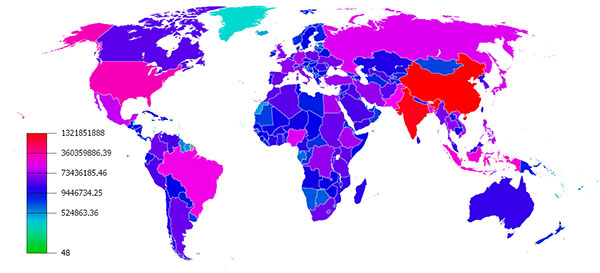
GunnMap 2
This Web-based application is very straightforward and easy to use. Simply paste in your data set or use one of the example sets to create a robust, color-coded map. This worldwide population map took under two minutes to customize and the final map is clickable and interactive.
Data Sources
- Data.gov: The Data.gov website has 210,912 datasets that are open and freely available for download and use. Many of the data sets are viewable via interactive maps.
- ARDA – The Association of Religion Data Archives: This website has also got its own GIS Maps section where users can plot religious data sets over neighborhood and/or world maps.
- Census.gov: The US Census Bureau's website holds the most recent version of the US census which is freely downloadable for visitors. They also have a data visualizations gallery where they spotlight infographics and maps in which Census Bureau data sets have been used.
- CIA World Factbook: The World Factbook, is prepared by the Central Intelligence Agency and provides information on the history, people, government, economy, geography, communications, transportation, military, and transnational issues for 267 world entities.
- Eurostat: Eurostat's mission is to be the leading provider of high quality statistics on the European Union and candidate countries.
- Global Health Observatory: This collection has over 50 datasets on priority health topics including mortality and burden of diseases, the Millennium Development Goals (child nutrition, child health, maternal and reproductive health, immunization, HIV/AIDS, tuberculosis, malaria, neglected diseases, water and sanitation), non communicable diseases and risk factors, epidemic-prone diseases, health systems, environmental health, violence and injuries, equity among others.
- Harvard Dataverse Network: This is a repository for sharing, citing and preserving research data; open to all scientific data from all disciplines worldwide. It includes the world's largest collection of social science research data.
- HUD.gov: The U.S. Dept of Housing and Urban Development offers quite a few downloadable data sets.
- International Monetary Fund (IMF) Data: The IMF (International Monetary Fund) publishes a range of time series data on IMF lending, exchange rates and other economic and financial indicators.
- NOAA: The National Oceanic and Atmospheric Administration: NOAA's National Climatic Data Center (NCDC) is the world's largest provider of weather and climate data. Land-based, marine, model, radar, weather balloon, satellite, and paleoclimatic are just a few of the types of datasets available.
- NYC Open Data: This collection has over 800 sets of data pertaining to New York City, most of which can be viewed as an interactive map. Sets include graffiti locations, locations of toilets in public parks, wifi hotspot locations, subway entrances, and more.
- The Roper Center: This open collection has 19,000 datasets reflecting public opinion and social trends including Gallup polls dating back to 1936, Roper Reports and more.
- UNdata: The United Nations Statistics Division (UNSD) of the Department of Economic and Social Affairs (DESA) launched a new internet based data service for the global user community to provide free access to global statistics.
- The World Bank Data Collection: The Data Catalog provides download access to over 8,000 indicators from World Bank data sets, searchable by country, indicators, or topic.